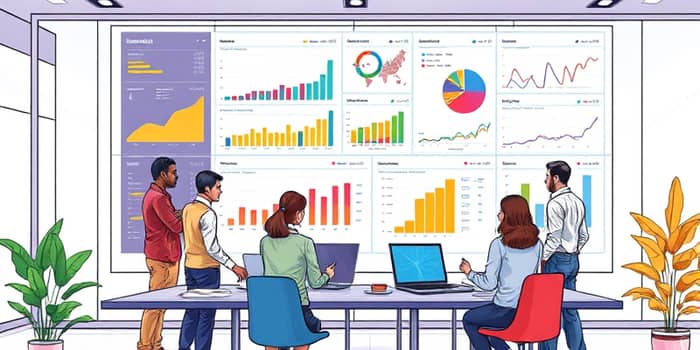
In today’s data-driven landscape, organizations seek tools that transform raw information into actionable insights. Real-time visual dashboards have emerged as a cornerstone technology for monitoring resource allocation, enabling teams to make informed decisions instantly and maintain a competitive edge. By consolidating metrics from multiple systems into a unified interface, these dashboards offer unparalleled operational visibility across teams.
At their core, real-time dashboards are interactive platforms that display up-to-the-minute data from diverse sources—databases, APIs, spreadsheets, and enterprise systems—using charts, graphs, gauges, and tables. Unlike static reports that require manual updates or periodic refreshes, these dynamic tools automatically refresh as new information arrives, ensuring stakeholders always view the latest metrics.
With the ability to highlight emerging trends and anomalies immediately, real-time dashboards empower teams to respond swiftly to shifting demands, optimize processes, and preempt potential bottlenecks. They bridge the gap between data collection and decision-making by presenting complex datasets in intuitive visual formats.
Effective allocation dashboards incorporate several core capabilities to ensure teams can allocate resources intelligently and efficiently. Below are essential features that transform static data into dynamic decision-making and strategic alignment:
Organizations across industries leverage real-time dashboards to streamline resource allocation, drive efficiency, and support strategic objectives. Common applications include dynamic resource reallocation, budget management, performance analysis, and project tracking.
Dynamic Resource Reallocation—Managers can reassign personnel or assets on the fly when projects face unexpected demands or constraints. This adaptability ensures optimal utilization of talent and equipment.
Budget Management and Forecasting—By comparing planned versus actual resource expenditure in real time, finance teams maintain tight control over budgets, identify cost variances early, and refine forecasts proactively.
Performance Analysis—Dashboards uncover patterns in workload distribution, project delays, and capacity gaps, guiding process improvements and staff training efforts where they matter most.
Project Tracking—Milestone progress, dependency statuses, and risk indicators are displayed alongside allocation metrics, ensuring resources are aligned with critical project timelines.
While the benefits are substantial, deploying real-time dashboards can present hurdles that organizations must address to maximize return on investment:
Data Overload: Including too many metrics can overwhelm users and obscure critical insights. Prioritize KPIs that directly support allocation decisions.
Timeliness and Accuracy: The value of real-time insights hinges on the speed and reliability of data ingestion. Invest in robust integration frameworks and redundancy measures.
Visualization Design: Effective use of color palettes, chart types, and layout is essential for understandability and user adoption. Conduct usability testing to refine interfaces.
Real-time visual dashboards transform resource allocation from a reactive chore into a proactive strategic advantage. By offering immediate visibility into performance and seamless integration of data sources, these tools empower organizations to optimize staffing, control budgets, and accelerate project delivery.
As data volumes continue to grow, the need for enhanced decision-making and planning agility becomes ever more critical. Implementing well-designed real-time dashboards ensures that every allocation choice is backed by the latest insights, driving teams toward greater efficiency, collaboration, and success.
References


